HR

Human Capital Management

Sustainability - Human Capital Management

Labor Practices

Human Capital Management

Public Relations Section

Basic HR Management Philosophy

Policy

Basic Policy on Human Resource Strategy

We view human resources as the human capital from which our value creation derives and so we work to strengthen and extract the full potential of our diverse range of personnel, and be an organization where people and the company grow together.

We strive to maximize company performance by expanding environmental improvements and strengthening our human capital from the perspective of an AMO framework rooted in the ever-changing business environment and internal matters.
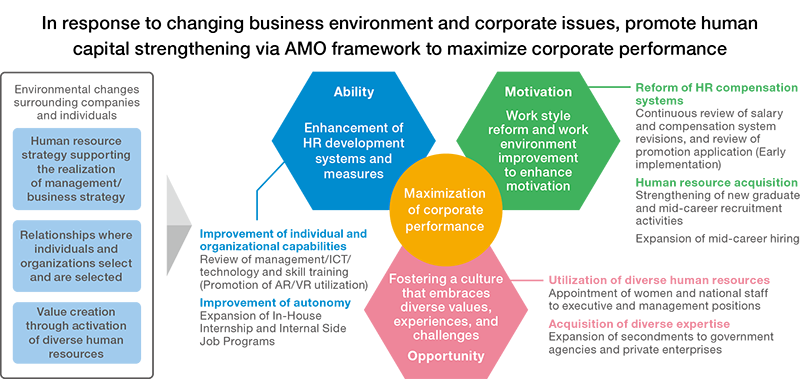
Basic Policy on Human Resource Strategy
Public Relations Section

Metrics and Targets

Targets

Metrics and Targets

The Meiden Group has set the following target values.

Some of our present metrics are disclosed for Meidensha only because we are currently constructing a system for aggregating personnel information on a consolidated basis and are facing issues involving data comprehensiveness and integration. We will continue to construct a system that collates and discloses data on human capital in a consolidated format and gradually transition to disclosing consolidated data.


Metric Target FY2024 Results
Percentage of female managers FY2030: 12% 5.4% (Meidensha only)
Number of female officer class (inside officers) employees FY2030: At least 3 (of which, at least 1 executive officer) 1
Non-Japanese presidents of local subsidiaries FY2030: At least 5 (of which, at least 1 executive officer) 2
eNPS* FY2027: -65.0% -69.0%

scrollable

  • *Employee Net Promoter Score. NPS® is a registered trademark of Bain & Company, Inc., Fred Reichheld, and Satmetrix Systems, Inc. The eNPS is stated as a percentage. Furthermore, eNPS applies to Meidensha and domestic affiliates excluding EAML Engineering CO.,LTD. and MEIDEN UNIVERSAL SERVICE LTD.
Public Relations Section

Results Data

Results Data

HR Data

Basic Data

Employees (only Meidensha)
Units FY2022 FY2023 FY2024
Number of employees (non-consolidated) Male People 3,425 3,458 3,474
Female People 614 665 679
Total People 4,039 4,123 4,153
Domestic subsidiaries Male People 3,287 3,210 3,263
Female People 494 480 522
Total People 3,781 3,690 3,785
Overseas subsidiaries Male People 1,595 1,609 1,578
Female People 401 388 370
Total People 1,996 1,997 1,948
Number of consolidated employees*1 Male People 8,307 8,277 8,315
Female People 1,509 1,533 1,571
Total People 9,816 9,810 9,886
Number of foreign employees
(non-consolidated)
Male People 26 21 28
Female People 10 12 10
Total People 36 33 38
Domestic subsidiaries
Number of foreign employees
Male People 9 10 7
Female People 3 3 3
Total People 12 13 10
Overseas subsidiaries
Number of foreign employees
Male People 1,466 1,493 1,486
Female People 399 386 368
Total People 1,865 1,879 1,854
Number of foreign consolidated employees*1 Male People 1,501 1,524 1,521
Female People 412 401 381
Total People 1,913 1,925 1,902
Proportion of all employees accounted for by contractors and temporary workers % 13.5 12.9 13.9
Average age*2 Male Age 43.3 43.6 43.7
Female Age 42.8 42.4 42.7
Total Age 43.3 43.4 43.6
Years of employment*2 Male Years 19.0 19.1 19.1
Female Years 19.1 18.3 18.7
Total Years 19.0 18.9 19.0
Number of managers*2 Male People 968 967 988
Female People 51 49 52
Foreigners People 5 4 4
Managers of level of general manager or above*2 Male People 201 204 204
Female People 4 4 10
Foreigners People 0 0 0
For reference: Number of management personnel Male People 680 693 548
Female People 29 37 31
Total People 709 730 579
Officers*2 Male People 36 37 33
Female People 1 1 3
Foreigners People 0 0 0
Executive officers*2 Male People 30 31 27
Female People 0 0 1
Foreigners People 0 0 0
Proportion of women*2 Managers*3 % 5.00 4.82 5.00
Management positions % 4.1 5.1 5.4
Managers of level of general manager or above % 1.95 1.92 4.67
Officers % 2.70 2.63 8.33
Executive officers % 0 0 3.57
Number of overseas local CEOs*1 People 1 2 2
Number of people with disabilities employed (legal count)*4 *5 People 109 115 120
Number of employees with disabilities (actual)*4 People 77 82 89
Rate of employment of people with disabilities*4 *5 % 2.48 2.56 2.66
Legally mandated percentage of employees with disabilities % 2.3 2.3 2.5
Number of employees leaving the company (voluntary) Male People 69 107 93
Female People 20 21 15
Total People 89 128 108
Rate of employees leaving the company (voluntary)*6 Male % 2.0 3.1 2.7
Female % 3.2 3.2 2.2
Total % 2.2 3.1 2.6
Rate of union membership % 65.3 64.4 69.9
Annual average salary 円 7,428,633 7,351,896 7,605,882

scrollable

  1. *1Applicable organizations: The Meiden Group
  2. *2As of March each year
  3. *3Number of female managers are divided by number of total managers.
  4. *4Applicable organizations: Meidensha and special subsidiaries up to FY2022. From FY2023 onwards, Meidensha, special subsidiaries, and Meiden Master Partners
  5. *5The number was calculated in consideration of those with severe disabilities, etc.
  6. *6Ratio of employees leaving the company is calculated as follows: Number of people that have voluntarily left their position in the last fiscal year as of the end of each fiscal year/number of employees as of April 1 each fiscal year
Number of Employees by Age (only Meidensha) (as of March 31, 2025)
Male Female Total
Under 30 621 170 782
30-39 718 83 801
40-49 630 127 757
50-59 1,136 256 1,392
60 or over 378 43 421

scrollable

Graduate Recruits (only Meidensha)
University graduate Technical college graduates Junior college/vocational school graduates High school graduates/other Total
Male Female Total
Joined April 2017 54 14 68 6 0 29 103
Joined April 2018 54 11 65 5 0 27 97
Joined April 2019 60 15 75 5 0 47 127
Joined April 2020 52 16 68 6 3 32 109
Joined April 2021 55 14 69 4 5 42 120
Joined April 2022 56 19 75 5 5 38 123
Joined April 2023 53 23 76 5 9 27 117
Joined April 2024 41 11 52 9 6 33 100

横スクロールしご確認ください

  • * Graduates includes those who have completed a degree at a graduate school or an advanced course at a technical college.
Mid-Career Hires (only Meidensha)
  University graduate Other Total
Male Female Total Male Female
2016.4 - 2017.3 26 2 28 5 1 34
2017.4 - 2018.3 29 3 32 2 5 39
2018.4 - 2019.3 28 4 32 24 7 63
2019.4 - 2020.3 45 1 46 12 1 59
2020.4 - 2021.3 40 4 44 10 3 57
2021.4 - 2022.3 29 2 31 14 2 47
2022.4 - 2023.3 39 7 46 6 3 55
2023.4 - 2024.3 22 7 29 12 8 49
2024.4 - 2025.3 56 1 57 11 7 75

scrollable

  • *Graduates includes those who have completed a degree at a graduate school or an advanced course at a technical college.
Work Style-Related (only Meidensha)
  Units FY2022 FY2023 FY2024
Employee engagement
(eNPS rate)
Actual score *1 % -65.0 -66.2 -65.7
Success rate
(vs FY2021)
-1.4% -2.6% -2.1%
People taking maternity leave*2 People 17 12 16
Male employees whose spouses gave birth during the current fiscal year Male People 101 85 74
Female People 18 10 15
Total People 119 95 89
People who took parental leave*1 Male*3 People 14 25 28
(within 1 week)*4 57 50 51
Female*5 People 18 12 13
Total People 89 87 92
Rate of People who took parental leave Male % 70 88 107
Female % 100 120 87
Total % 75 92 103
Rate of return after leave of absence for child care purposes Male*6 % 100 100 93
Female % 100 83 100
Total % 100 96 97
People taking family care leave*7 People 3 1 1
Average days of paid leave allocated Days 23 23 23
Average days of paid leave taken*8 Days 18 17 18
Rate of taking paid leave % 78 74 77
Average total hours worked per year*9 hours/year/person 1,957 1,954 1,948

scrollable

  • *1:eNPS applies to Meidensha and Meiden Engineering.
    Target values listed in the 2024 Mid-Term Management Plan are: eNPS (employee NPS*) 10% improvement in FY2024 vs FY2021 (-63.6% → -53.6%)
  • *2:Number of female employees who began accuring maternity leave during the fiscal year
  • *3:Number of male employees who began paternal leave during the fiscal year (except short-term leave)
  • *4:Number of male employees accuring special leave (partner giving birth) or short-term leave (accumulated leave) during the fiscal year
  • *5:Number of employees who began paternal leave during the fiscal year
  • *6:Except those accuring leave to raise children
  • *7:Number of employees who began family care leave during the fiscal year
  • *8:Average number of days of paid leave in Meidensha (hourly managers only)
  • *9:Cumulative number of hours worked in Meidensha alone (hourly managers only)
    The total number of hours worked during the year is the total number of hours worked as calculated by adding together scheduled working hours and overtime and then subtracting hours of paid leave during said year./li>
Proportion of Employees that Underwent a Periodic Review of Results and Career Development (only Meidensha)
  Units FY2022 FY2023 FY2024
Proportion of employees that receive feedback interviews Male % 94.8 92.8 88.8
Female % 96.0 95.5 92.6
Total % 94.0 89.4 89.4
Managers % 93.6 89.9 86.6
Regular employees % 93.9 94.2 90.3
Total % 94.0 89.4 89.4

scrollable

Public Relations Section