Sustainability - Climate Change
Since its establishment in 1897, Meidensha has produced a range of technologies, products, and services and contributed to the development of a sustainable society in its role as a manufacturing company. In particular, we are deeply involved with decarbonization and reduction of carbon through power generation systems that utilize renewable energy sources such as solar, wind, and small to medium hydroelectric, as well as energy solution services such as smart grids. Through these eco-friendly products and services, we aim to achieve a sustainable society and are working to reduce greenhouse gas emissions from business activities.
As the highest decision-making body for environmental activities, the Sustainability Management Strategy Committee, which is chaired by the President, deliberates on responses and other actions to issues including risks posed by climate change, and also determines the direction of sustainability management. As part of its role, this committee refers important matters to the Executive Officers’ Meeting and the Board of Directors, etc., to initiate activities based on executive-level decision-making.
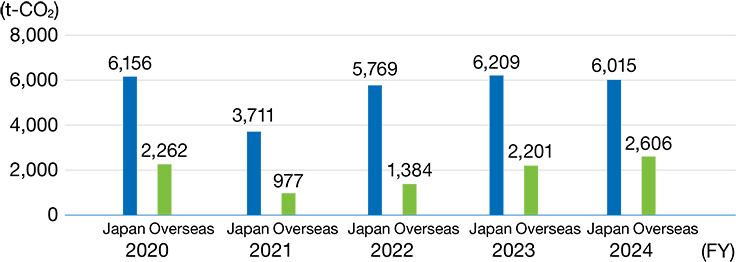
To enhance activities towards mitigating our environmental impact, we use internal carbon pricing and source CO2-free electricity (in FY2024, we expanded the procurement ratio at Numazu Works and Kofu Meidensha). As a result, Scope 2 emissions fell even as production increased. Overall Scope 1 emissions fell thanks to decreased use of combustion furnaces, even as the use of drying furnaces rose and SF6 gas emissions increased due to greater production of power equipment products. We will continue working to control Scope 1 and 2 emissions by continuing to promote energy-saving activities, expanding procurement of carbon-free power, eliminating SF6 gas, electrifying drying furnaces, and more.
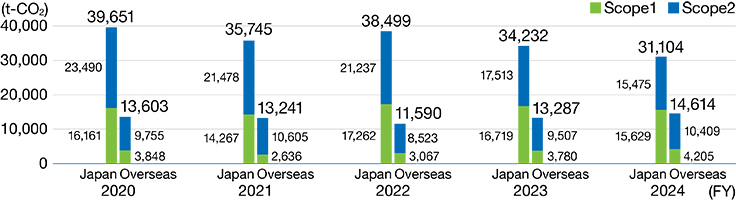
Scope 1: Direct Emissions
Combustion of fuel (town gas and oil, etc.) and release of greenhouse gasses (SF6 and CFCs, etc.)
Scope 2: Indirect Emissions
Combustion of fossil fuel to generate electricity (electricity company) that is consumed by the company
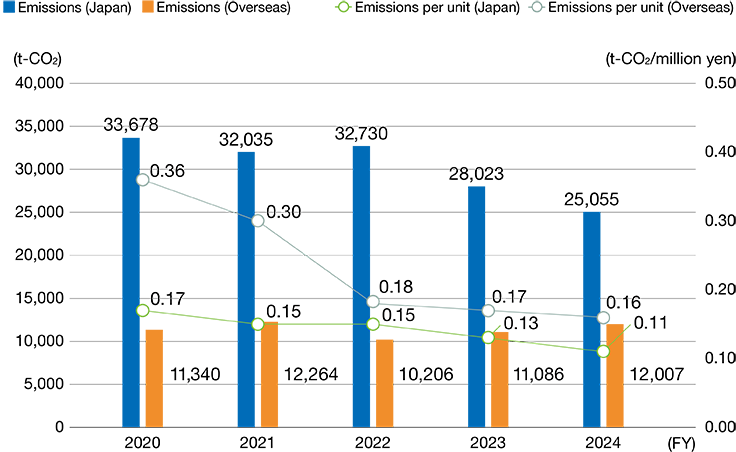
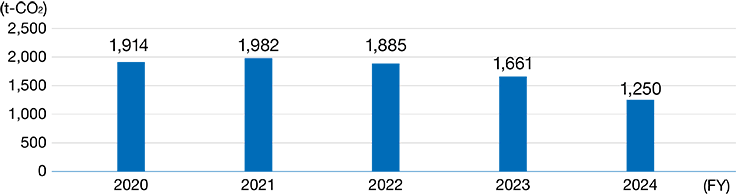
The Meiden Group had record sales in FY2023 and lowered its CO2 emissions per unit of sales.
We also drove down CO2 emissions by increasing the proportion of renewable energy used at Numazu Works, the Group’s largest production site in Japan.
In recent years, we have procured electricity from renewable sources in an effort to reduce CO2 emissions from business activities.
Since FY2019, we have been working on sourcing electricity with non-fossil certificates and purchasing power from renewable sources.
In FY2024, we signed an offsite physical corporate PPA* on April 1 to use power generated by renewable energy from the Choshi Shiosai Wind Farm owned and operated by our associate company M WINDS Co., Ltd.
To control rises in Scope 2 emissions from increased production, we are expanding the use of power derived from renewable energy sources. In Japan, the percentage of renewable energy increased from 30% in FY2023 to 41% in FY2024. Moving forward, we plan to utilize onsite power generation, PPAs, renewable energy charts, and renewable energy certificates as we expand the ratio of renewable energy in our production sites around the world, with the goal of 100% of our four major production sites in Japan and 50% of our nine overseas sites powered by renewable energy by the end of FY2027.
| FY2019 |
November: Began sourcing CO2-free electricity from wind power through non-fossil certificates with tracking information at the Meiden R&D Center and Osaki Kaikan Hall. |
|---|---|
| FY2020 |
November: Signed a contract for CO2-free electricity at EAML Engineering CO., LTD. and reached 100% renewable energy use. |
| FY2021 |
April: Signed a contract for CO2-free electricity at Meidensha’s Ota Works and reached 100% renewable energy use. January: Signed a contract for CO2-free electricity at MEIDEN NANOPROCESS INNOVATIONS, INC. (Chiba) and reached 100% renewable energy use. |
| FY2022 |
May: Signed a contract for CO2-free electricity at KOFU MEIDENSHA ELECTRIC MFG. CO., LTD. and reached 30% renewable energy use. May: Began sourcing CO2-free wind power at headquarters of MEIDEN KOHSAN CO., LTD. using non-fossil certificates with tracking information. |
| FY2023 |
July: Signed a contract for CO2-free electricity at Meidensha’s Numazu Works and reached 20% renewable energy use. July: Signed a contract for CO2-free electricity at Meidensha’s Headquarters (ThinkPark Tower) and reached 100% renewable energy use. |
| FY2024 |
April: • Signed contract to source CO2-free electricity for 100% of the power used at three Group sites in the Tokyo area (R&D Center, Osaki Kaikan Hall, and MEIDEN KOHSAN CO., LTD.) (86% under Green Basic Plan contract, 14% under offsite physical corporate PPA). • Meidensha’s Numazu Works gets 34% of its power from CO2-free electricity, while KOFU MEIDENSHA ELECTRIC MFG. CO., LTD. gets 44% (in addition to previous sources, it procures 14% under an offsite physical corporate PPA) • Meidensha’s Ota Works switched from the Gunma Hydro Plan to the Green Basic Plan and now sources CO2-free electricity derived from solar, wind, and other forms of energy for 100% of its power |
| FY2025 |
April: • KOFU MEIDENSHA ELECTRIC MFG. CO., LTD. switched to a Green Basic Plan and now sources CO2-free electricity derived from solar, wind, and other forms of energy for 100% of its power. • Signed a contract for CO2-free electricity at Meidensha’s Nagoya Works and reached 100% renewable energy use. • Signed a contract for CO2-free electricity at Meidensha’s Numazu Works and reached 60% renewable energy use (of which 46% comes from a Green Basic Plan and 14% comes from an offsite physical corporate PPA) |
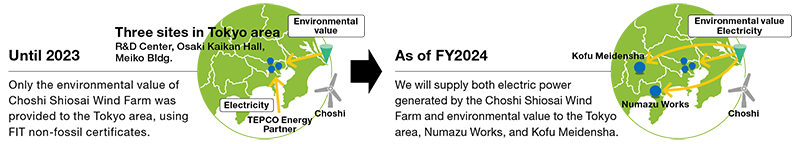
On April 1, 2024, Meidensha, M WINDS Co., Ltd., and TEPCO Energy Partner, Incorporated (“TEPCO EP”) entered into an offsite physical corporate PPA (“the PPA”). This arrangement uses electric power from renewable energy (“the renewable power”*1) from Choshi Shiosai Wind Farm (“the power plant”) owned and operated by M WINDS, a wholly owned subsidiary of Meidensha.
Under the PPA, a portion of the electricity used at five Meiden Group business sites is now renewable power from the power plant.
(As of April 2024)
More than 20 years have passed since the plant started operating in December 2003, and the FIT period (October 2012 - March 2024) has now elapsed. The three companies concluded the PPA to maximize the value of the wind power plant owned by the Meiden Group and enhance corporate value.
For the three businesses, this is a first-time experiment with a PPA using a wind farm that has moved past the FIT program.
1. Overview of the PPA
Concerning the renewable power generated with the plant, the previous arrangement used FIT non-fossil certificates*2 with tracking information by TEPCO EP to provide only environmental value to three Tokyo area sites of the Meiden Group (R&D Center, Osaki Kaikan Hall, and Meiko Bldg.) using the Green Basic Plan.*3
Now that the PPA has been concluded, both the power generated at the plant and the environmental value will be provided, in addition to the Green Basic Plan that TEPCO EP was already offering. With the addition of Meidensha’s Numazu Works and KOFU MEIDENSHA ELECTRIC MFG. CO., LTD.
(“KOFU MEIDENSHA”), a total of five locations will be supplied. Another advantage is that the Meiden Group can use the PPA to stabilize the cost of sourcing some of its electricity, regardless of changes in fuel prices.

Internal carbon pricing is a mechanism to promote investment in equipment with a significant CO2 reduction benefit. It works by setting a carbon price within a company and then using that price to calculate the cost of greenhouse gas emissions.
Meidensha introduced an internal carbon pricing system in April 2021. We use it as a resource when making investment decisions by converting carbon emissions from capital investment plans into expenses using our internal carbon price. At Meidensha, we initially set 3,000 yen/t-CO₂ as the internal carbon price. However, after considering the Ministry of the Environment’s guidelines and the carbon price in the IEA’s 1.5°C scenario, we raised our internal price to 15,000 yen/t-CO₂ and applied that price to capital investments from FY2023 onwards. We will continue to promote reductions in greenhouse gas emissions in our business activities by considering environmental impact mitigation along with safety and productivity when making equipment investment decisions.
There were ten cases in FY2024 in which we applied internal carbon pricing. For example, we introduced equipment that is expected to significantly lower CO2 emissions, such as upgrading the air-conditioning equipment at the Meiden R&D Center and replacing lighting at the Headquarters with LED bulbs.
| Equipment subject to internal carbon pricing (FY2024) | 387 (million yen) |
|---|---|
| Reduction due to internal carbon pricing (FY2024) | 574 (t-CO2) |
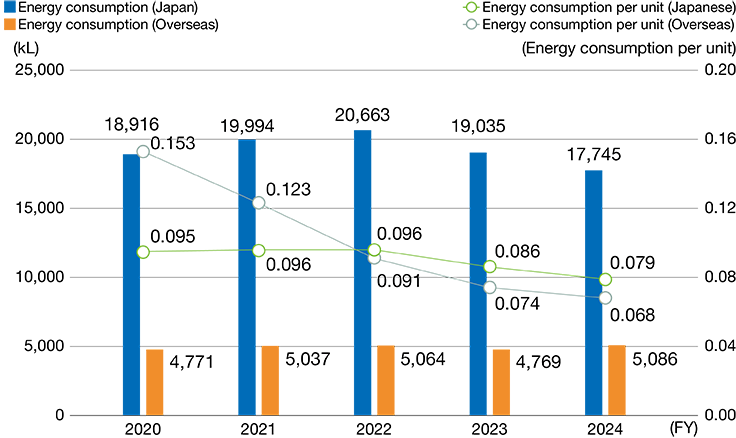
The Meiden Group makes capital investment systematically, such as introducing internal carbon pricing and replacing lighting and air-conditioning with high-efficiency equipment, to lower greenhouse gas emissions caused by energy consumption. We are in addition visualizing our power consumption and improving equipment operations, especially by practicing strict energy consumption control, such as cutting standby energy consumption on holidays and at night. To use energy more efficiently, expand energy conservation awareness, and reduce energy costs, each works and unit is endeavoring to save energy. Energy conservation rankings, showing energy use reductions, are posted on digital signage to foster awareness of energy conservation.
The Meiden Group’s emissions of greenhouse gasses other than CO2 include SF6 gas, which is used for circuit breakers, etc., and CFCs, which are used as refrigerants in air conditioners.
In FY2024, emissions of SF₆ gas remain high due to increased production of equipment such as circuit breakers. We will continue our efforts to curb emissions and perform technical studies and verification of alternatives to SF6 gas. To curb CFC emissions, moreover, we are strengthening management of air-conditioning equipment and updating facilities.
The transport division is working to reduce CO2 emissions by practicing cargo consolidation, modal shift, and efficient transport, such as using shipping containers and switching from trailer transport to ship transport from nearby ports.
Meidensha is working to calculate greenhouse gas emissions, including indirect emissions in the upstream and downstream supply chain in addition to those produced in the course of its business activities.
Meidensha is facing the issue of producing a large proportion of its emissions from “use of sold products” (scope 3, category 11) and “purchased goods and services” (scope 3, category 1). We are promoting environmental measures throughout the entire supply chain, including reducing downstream greenhouse emissions through environmentally considerate product design and reducing upstream impact through green procurement.
The Meiden Group calculates our supply chain with reference to the GHG Protocol and the Basic Guidelines on Accounting for Greenhouse Gas Emissions Throughout the Supply Chain, published by the Ministry of the Environment and the Ministry of Economy, Trade and Industry, etc.
In developing the Third Meiden Environmental Vision, which launched in FY2025 and set new medium- to long-term environmental targets, we reviewed Scope 3 calculation methods. We added Categories 9, 10, and 15 into the scope of calculations and partially revised the calculation methods for the other Categories.
Thus, data values disclosed up to FY2023 cannot be compared directly, but going forward we intend to trace these values using this calculation method and revise them as necessary.